(Originally posted 2008-06-16.)
I’m not sure if anyone’s done this before. Certainly I’ve not seen any results…
We’re beginning to write up some tests the “A Team” (Alain and Pierre) ran before their return to France. Which provides me with some test data. Fortunately I had a stab at mapping the new fields this data contains. One in particular is Stucture CPU (R744SETM)…
So, I got to plotting CPU per request against request rate (as well as elapsed time against request rate). I did this for two structures:
- LOCK1 – which has between 750 and 925 requests a second – based on 1 minute RMF intervals.
- ISGLOCK – which has between 5 and 65 requests a second.
The high request rate LOCK1 case is less interesting for the purposes of this discussion. The chart below is for ISGLOCK. I think it’s revealing.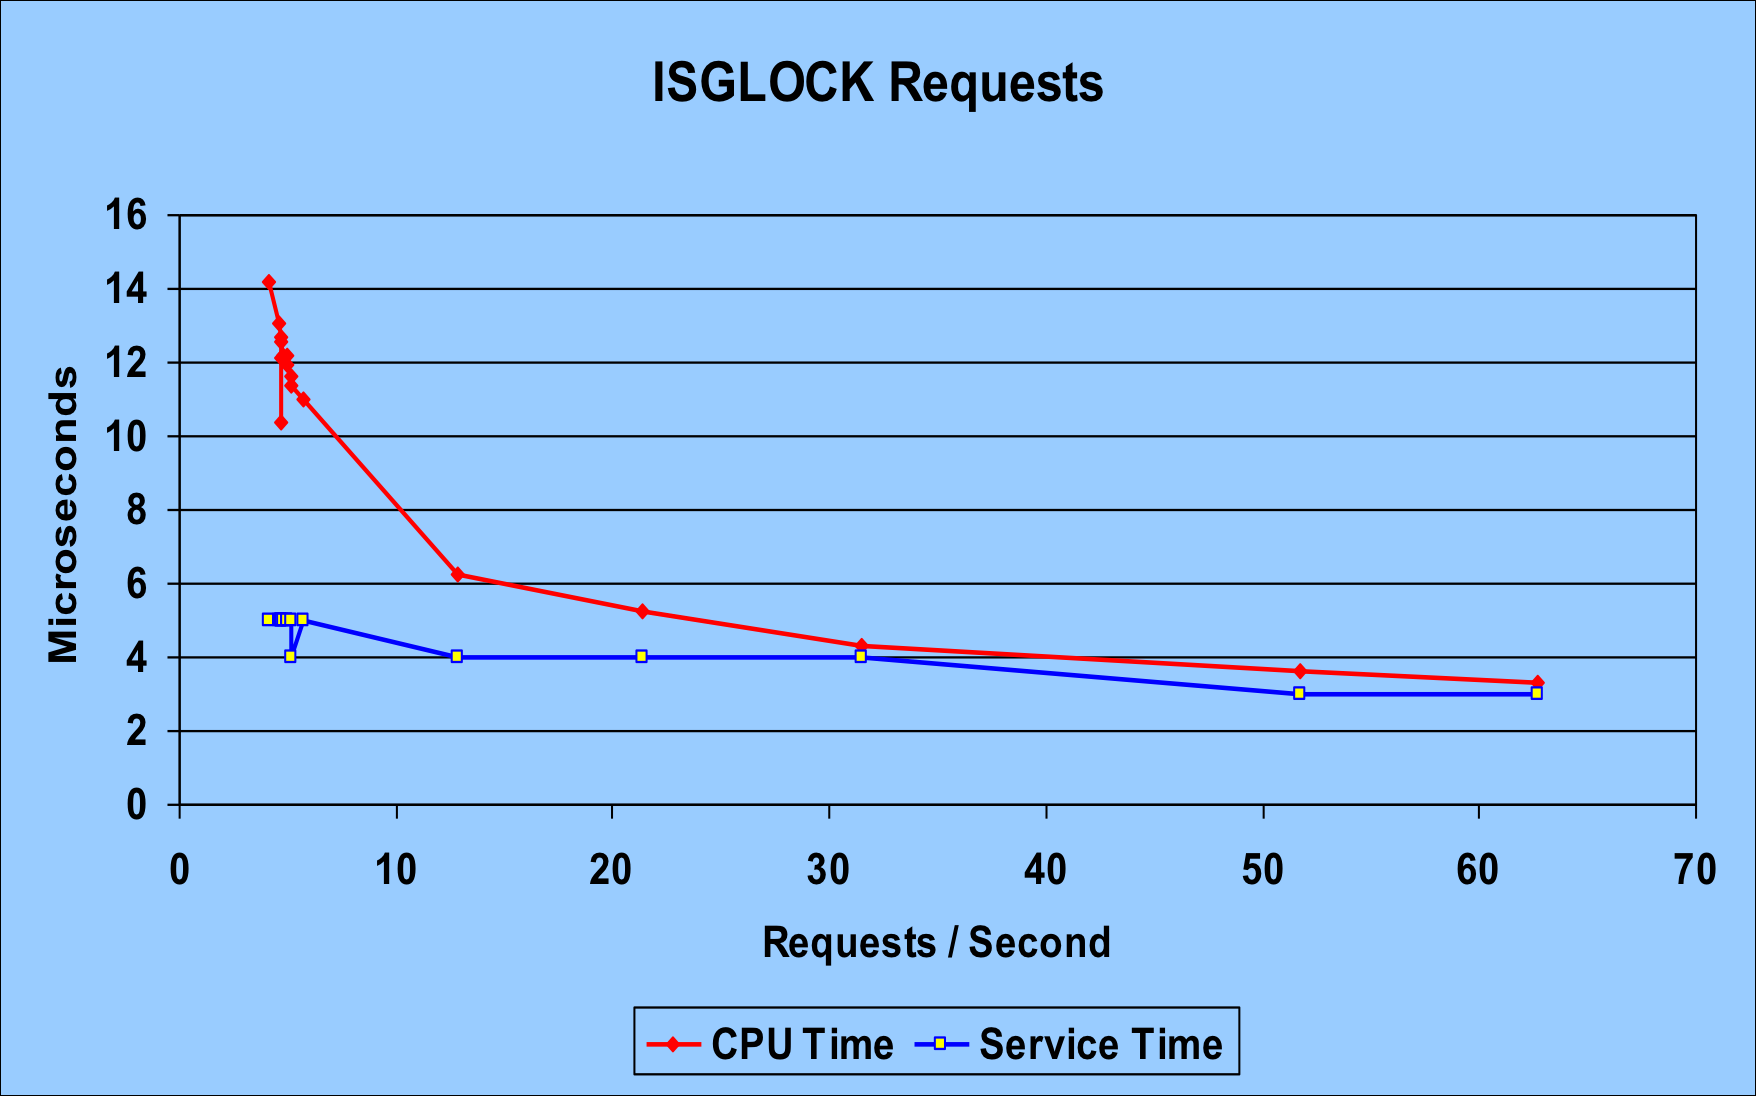
The red line is the CPU time per request. Most importantly it goes down with the number of requests. That strongly suggests to me that there’s a “zero request rate” cost, which gets amortised over more requests as the rate increases. Now, some of this could just be Coupling Facility internal processes. Or it could be a cache effectiveness thing. And in any case maybe it’s RMF with its 1-minute intervals that’s driving the CPU consumption.
The blue line is the service time per request – which actually drops as the rate increases. This might be a “practice effect” or else some instrumentation effect. At any rate it drops rather less dramatically than the CPU time per request.
What’s also interesting is that the CPU time and the service time converge somewhat. You’d expect the service time to be more than the CPU time – for a request. But, as you can see from this blog entry that isn’t always the case.
So, the net result of this test is that there’s CPU to amortise over the requests and at lowish rates this can be enough to make it longer than the service time.
For ISGLOCK – locking with no record data payload – it’s pretty much all CPU time, so long as nothing else gets in the way. (Such as path / subchannel delays or extreme CPU queuing in the coupling facility. Or, more to the point, link latency.)
For LOCK1, the request rate was much too high to see the amortisation in action and CPU was always about 4μs vs service time of around 10μs per request. LOCK1 does have record data to manipulate.
There’s one other consideration, though: LOCK1 was in a coupling facility with a mixture of ISC and ICB links. ISGLOCK was in a coupling facility accessed using IC links. That probably accounts for some of the 10μs. for LOCK1 vs 3.5μs for ISGLOCK. In fact, the CPU time per request for LOCK1 was about 4μs out of the 10μs. Which suggests quite a bit of link latency.)
It’s a new-found frustration of mine that the instrumentation doesn’t tell me much about traffic by link or link type. (Earlier in the residency I messed around with channel activity and queuing record types. Perhaps I’ll have to mess with it again.)
In “real world” terms bear in mind, however, that the 50 requests per second and upwards cases are much more interesting and common. So typical behaviour is towards the right hand end of the graph and beyond.
