(Originally posted 2014-03-01.)
The subtext of this post is “do try and keep up” – which is directed at me as much as anybody. 🙂 And is a perpetual state of being when you’re dealing with evolving SMF data and enterprise computing environments.
When I look at a system’s memory usage my code produces what I call a “PM2200”[1] chart. The giants on whose shoulders I balance precariously[2] first created PM2200 some time before 1993.
Back before REXX became viable for my reporting graphs were created by running a query against a single table and directly graphing the results. This meant you could only build a graph from a single data source. For example, RMF SMF 72–3 Workload Activity Report data.[3]
The Original PM2200 Chart – Workload Stack Up
The original PM2200 chart used Workload Activity 72–3 [4] data to stack up usage by WLM workload. This is fine but limited for a couple of reasons:
-
It says nothing about non-workload memory, such as CSA. And nothing about what is free.
-
It under-represents swappable workload. Work that is swapped in memory is using memory (obviously) but that isn’t counted in 72–3. This mainly affects Batch but also TSO.
Unity Is Strength
Fixing these two problems required uniting two sources of data:
- The aforementioned 72–3 Workload data.
- RMF SMF 71 Paging[5] Activity data.
Let’s start with SMF 71. It allows you to stack up all the private (think “workload”) and common areas and what’s free. These are called queues.[6] While each queue has maxima and minima[7] it’s best – for the stack up – to use averages.
But SMF 71 doesn’t tell you which workload is the big user. Combine SMF 71 and 72–3 memory perspectives by breaking down the overall Private Area storage usage according to the workload-specific information and stack these up together with the system-wide queues.
It also seemed reasonable to me to highlight the free memory by putting it at the top of the stack and ensuring it wasn’t shaded. Call it an “it’s empty” visual gag if you like.
And so PM2200 remained that useful breakdown of what’s free and what’s used for a while.
High Water Mark – Take 1
It seemed reasonable to me if I was going to graph usage by time of day to indicate the minimum memory free. So I put in a horizontal datum line that rests on the top of the “used” series. And I helpfully injected the minimum average free number into the chart title.
High Water Mark – Take 2
But then the events described in Enigma And Variations Of A Memory Kind took place.
For PM2200 this meant I changed the text in the title to use the minimum of the minimum while keeping the datum line unchanged. So now the possibility of surges in usage is catered for in PM2200 and other memory charts.
And PM2200 looked like this:
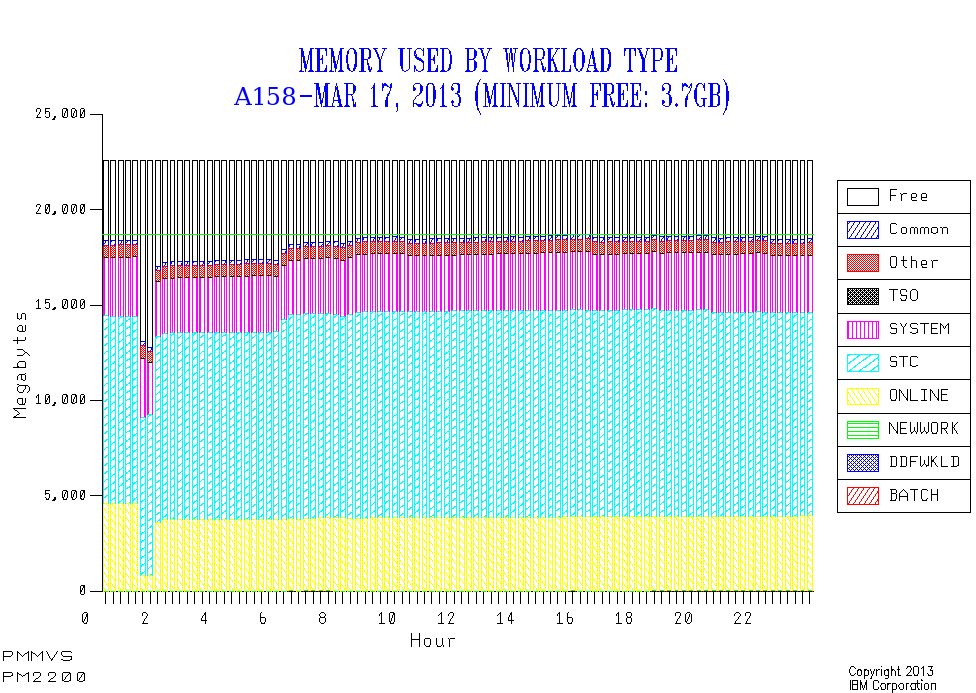
Notice how early in the morning the Online work got bounced. If this happens every day the nosey bit of me says “I’ve learned this customer likes to bounce their Onlines ever night”.
64-Bit Shared And Common
I hadn’t seen much usage of 64-Bit Shared or Common memory usage, despite DB2 V9 introducing a mandatory Shared 64-Bit memory object.
But then, and you probably guessed this one 🙂 , I got a set of customer data…
PM2200 – when first produced – looked simply awful[8]. The main problem with it is that not all the memory was accounted for. Further the supposed total memory was variable – which only really happens if you bring reserved memory[9] online and that’s a one-off event rather than continual variation.
A little guesswork suggested that maybe the discrepancy was 64-Bit Shared memory and 64-Bit Common memory. This turns out to be correct – and is corroborated by these two quantities appearing in the RMF Paging Activity Report.
So I adjusted PM2200 to also show 64-Bit Shared and 64-Bit Common. In this case the Shared memory was about 6GB. The Common was small. Adding them in led to a constant total memory as well as that total being the same as the memory online to the LPAR – both of which are goodness.
The latest version looks like this:
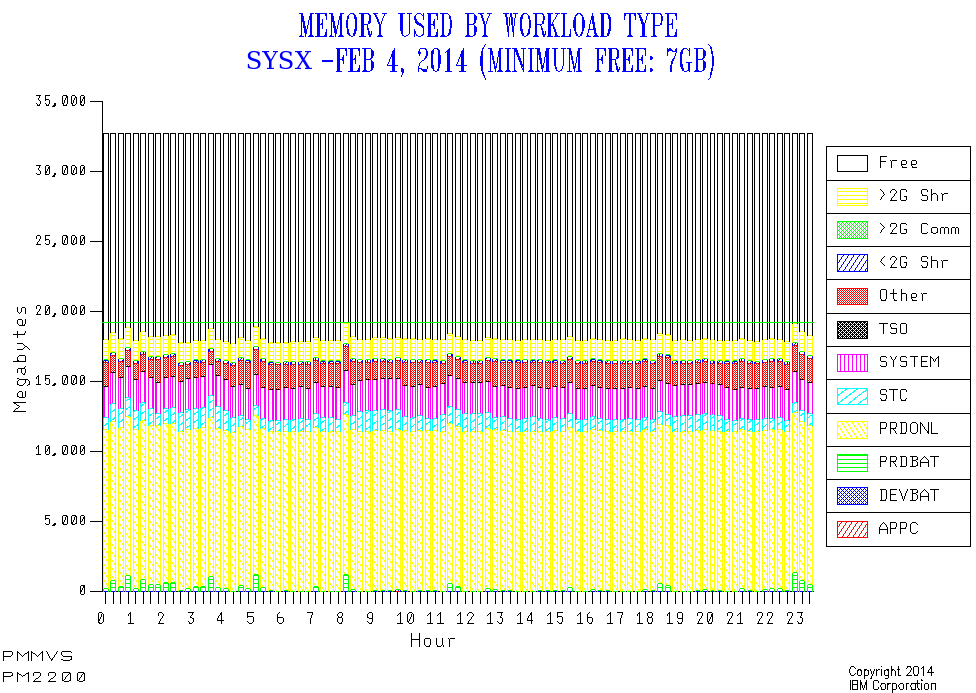
Now this is a much less extreme case than the one that made me go “sacre bleu!”
You can extend the analysis for 64 Bit right down to the address space level: SMF 30 has numbers for 64-Bit Private the address space owns and the Shared Memory the address space can see.[10].
You can also work at the WLM Service Class level: SMF 72–3 has the Shared figure in it. I didn’t have SMF 30 for the 6GB case so I used SMF 72–3 to identify one Service Class (“STC”) as owning the shared memory. I also didn’t have useful report classes to work with so couldn’t narrow it down further. What I do know is this probably isn’t DB2 as there are other service classes with “DB2” in their name. But I can’t be certain about this without the 30’s.
In principle I could break down the Shared and Common numbers further – by workload – but I think you’ll agree the chart is already very busy. I have some more design work to do but I think it calls for 1 or more further charts.
You can probably see why I led with “do try and keep up”. This post outlines how one’s reporting has to evolve for two reasons:
- To wring all the insight you can out of the data.
- To adapt your reporting to technological changes.
But it’s a continuous struggle and I recognise most people don’t have the time to maintain their reporting too much. Arguably it’s my job.
And just as I thought I was ready to publish this post another piece of information comes up. I had a discussion with the MQ on z/OS Development lead Peter Siddall [11] about whether MQ uses Shared or Common 64-Bit objects. If you’re migrating to MQ 7.1 (perhaps from 7.0.1) you might want to pay attention to this:
MQ 7.1 requires the ability to create 64-Bit Shared memory objects: If you don’t allow that then MQ won’t start. The actual memory usage is generally small and MQ Development recommend a MEMLIMIT of at least 2GB. In any case the usage can be tracked by SMF 30 and so on.
-
The tooling I now use and develop creates standard charts for, keeping it simple, each system for a specific day. These have standard names. ↩
-
You might think that self-deprecating but I don’t. ↩
-
In actual fact you could build a view across multiple tables but it was cumbersome. ↩
-
Historically it used Performance Group data but the giants quickly adapted the code to cope with WLM Goal Mode. Of course now there is only Goal Mode. ↩
-
Yes the record contains information about paging but it also contains other stuff. ↩
-
While you might think the term “queue” an odd one (and I did when I got started with MVS in 1985) it refers to lists rather than waiting (in line). ↩
-
Words considerably stronger than “sacre bleu” escaped my lips, I’m afraid. 🙂 ↩
-
RMF doesn’t know how much memory an LPAR has reserved. I’d like it to. ↩
-
Who owns the shared address space is a different matter. But it’s usually obvious, I think: For example, starting with DB2 V9 the DBM1 address space creates a 64-Bit Large Memory Object it shares with DIST (DDF) address space. That should be obvious to anyone who knows DB2. ↩
-
We actually went through Systems Engineering training together – between 1985 and 1987. And I think we were the two most technical SEs on Stream 38. 🙂 ↩
