(Originally posted 2014-09-28.)
As you’ve probably gathered I like to get nosy about how customers run systems. This is probably best and most recently exemplified by this blog post: Once Upon A Restart
So this post is about another piece of curiosity: What spikes can tell us about how people run systems. In a way it’s similar to what restarts tell us, hence the above blog post link.
I like “Think Fridays”. But I’ve been rather busy of late, so what I got to do this past Friday was brief, embryonic and just showing some of the potential of the method. In short it’s a prototype or an experiment. But, in line with the “Fink Thriday” 🙂 idea, it did get me thinking and exploring.
But such things don’t happen in a vacuum: I’ve noticed spikes in CPU and memory usage by address spaces before. Many times before. So that has gradually formed a question in my mind:
"Is there an event that triggers a spike in an address space?
Now, I’m not really thinking of the sorts of anomalies that zAware might learn to detect. I’m thinking of the more mundane “such and such happens every Tuesday night at 8PM” kind of event.
My Prototype
For my experiment / prototype I took a pair of LPARs. Let’s call them PROD and DEVT – for that is the roles these LPARs have.
I took SMF 30 Interval (Subtypes 2 and 3) records for both systems and examined a number of address spaces I’d spotted spiking:
- DFHSM – on both systems, in STCMD.
- DFRMM – on both systems, in STCMD.
- CATALOG – on both systems, in SYSTEM.
- An address space related to data extraction and transmission – on PROD, in STCMD.
For each of these I wrote code to examine CPU for each of these
- It computes the Average CPU across the whole set of data for the address space.
- It detects intervals where the address space uses at least 2x, 4x, 8x, 16x etc. the Average CPU.
Between these two I get spikes – whether broad or narrow, tall or short. Right now I just pump them out in a table – so lots of refinement can happen later on.
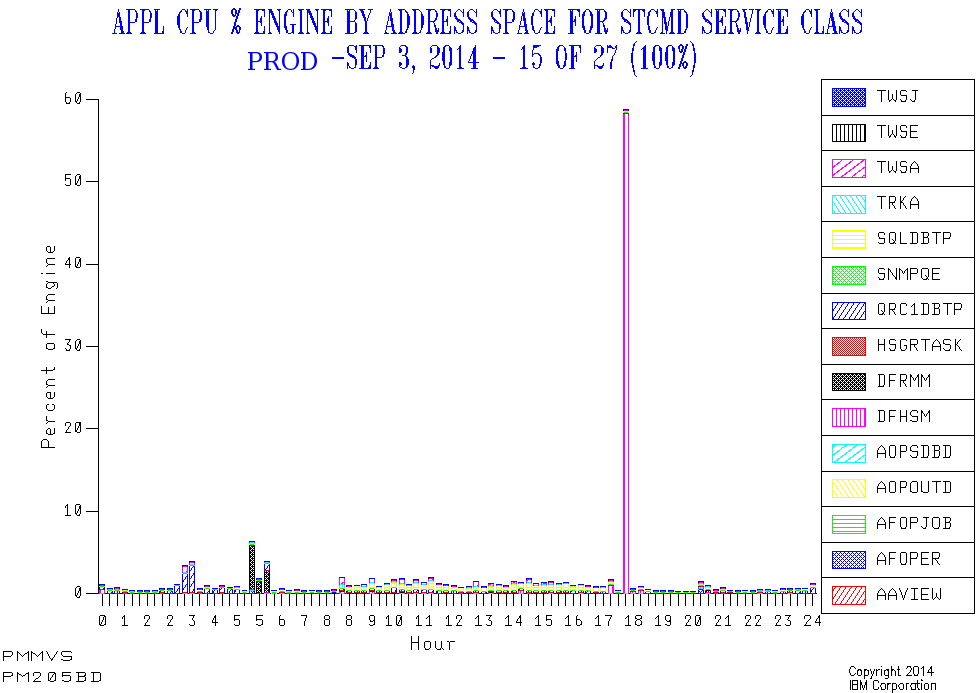
DFHSM
In PROD there’s a daily narrow spike around 5:30PM. And it’s a very substantial spike, CPUwise. So this looks like daily Space Management or similar daily functions. And its timing is regular as clockwork.
Here’s one day’s view of the service class that contains the DFHSM address space, as well as two of the other spiky address spaces.
In DEVT there’s a daily narrow spike around 8PM, but it’s not well-pronounced. But additionally there are lots of other, broader, episodes of well-above-average CPU consumption. The 8PM spike might well be Space Management or similar; It’s hard to tell. I expect Development LPARs will turn out to show this behaviour with DFHSM.
DFRMM
In PROD there are daily broad peaks – of around 45 minutes – just before the working day starts. But their incidence varies by as much as an hour and a half. Quite probably when the overnight Batch ends.
In DEVT there are narrower spikes at around the same time as PROD in the morning. But there are also narrow spikes around 8PM.
CATALOG
In PROD CATALOG has a number of spikes that line up with the previously-mentioned ones. As well as some in the evening Batch window.
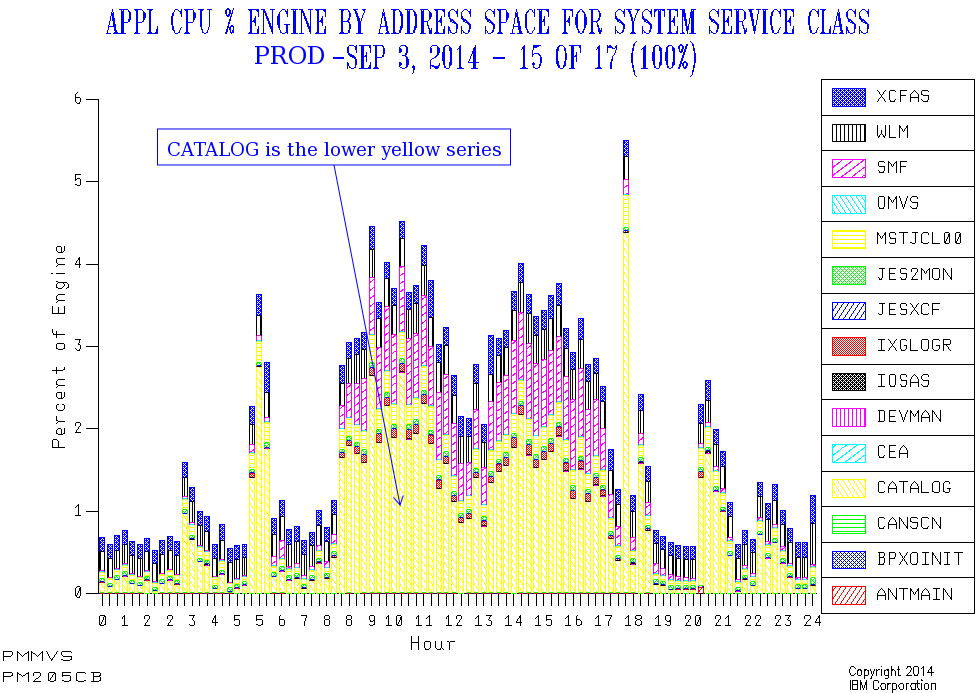
But here the picture is less stark – largely because the general daytime level of CATALOG CPU drives up the overall average.
In DEVT CATALOG CPU usage varies enormously, with no obvious spikes and no clear pattern. That too is probably a feature of Development workloads.
So I won’t claim the “spike” treatment is such a success for CATALOG: You can see the spikes from the graph, but my prototype code doesn’t throw them and their timing into sharp relief. So maybe I just need to work on the code some more.
Data Extract / Transmission Address Space
This only runs in PROD. Every day this spikes for a brief while, regularly each morning around 2:30AM to 3AM.
This doesn’t appear to be on a “timer pop” so much as having prereqs, but I’m not 100% certain of this; That would be something to ask the customer.
SMF Interval Accuracy
Obviously, using interval records, the timing of an event can only be approximated using this method. Most customers I know use 15 or 30 minute intervals, which is fine. And our code picks the midpoint of the interval as a timestamp.
So we’re not going to detect events this way to more than 7.5 – 15 minutes’ accuracy. But I think that’s enough.
Events Dear Boy, Events
Now, having said I’m not really looking for anomalies a la zAware, there is already one case where I do see happenings of the undesirable kind.
In the test data I’m working with I see DUMPSRV (Dump Services) suddenly use more memory at two points in the day. After each of these events memory usage returns to a very low value. CPU doesn’t show the same spikiness.
From my restart code I can see that a CICS region restarts (unusually) right after the second spike. So, based purely on SMF 30 Interval records it’s a reasonable guess that the region ABENDed and dumped at the time of the second spike. Not conclusive, but a reasonable guess. And the relationships between certain spikes and restarts is worth exploring.
Other Address Spaces And Metrics
I made arbitrary choices of job name, based on this set of data. I could equally have roped in such things as Sterling Connect Direct.
And I could look at all sorts of spikes, such as in EXCP rate, Virtual Storage Allocation and zIIP Usage. To do that I might have to make the code more specialised; For example, with DUMPSRV only looking at memory usage (not CPU).
Timer Pops And Movable Feasts
Timing – as with restarts – is interesting to me:
If something kicks off bang on, say, 8PM every single day what does that mean?
Perhaps this is conservatively timed and could be earlier and event-driven.
If something kicks off at the same time every day, but not on a timing boundary, what does that mean?
It might mean the processes in front of it are regularly but take a few minutes to complete. For example: CICS comes down at 8PM exactly but a post-shutdown job always completes at 8:03, allowing the batch to always start at the same time.
If something moves around what does that mean?
Perhaps the chain of events it depends on takes a variable amount of time to complete, which might be a problem. For example backups kicked off when the batch completes.
Conclusion
So I’m not telling the customer what to do about these spikes; There probably is nothing for them to do. But I feel I’m getting closer to how they operate. And maybe I’m seeing some challenges, such as the variability of timing of things that happen just before the online day.
As this was a quick experiment there are obviously some rough edges, and there’s more it could do.
I think I’m edging towards a “Day In The Life” approach to systems, key address spaces and applications. It might include both spikes and restarts. And probably the general “double hump” etc. patterns in workload we usually see. Now that could be useful. The journey continues… 🙂
