(Originally posted 2017-05-19.)
I’m starting to write this on a train to London. (Not Paris.)[1] When I get there I’m going to present the “New Improved” “Even More Fun With DDF” pitch to the UK GSE zCMPA user group.
I was done with the slides a few days ago – or so I thought.[2]
Well, I got some “down time” earlier this week to work on my DDF code some more – which resulted in another slide in the deck, and now this blog post.[3]
You might recall that I can – from SMF 101 (DB2 Accounting Trace) – discern the topology of machines connecting to DB2 via DDF. I wrote about it extensively in DDF Networking. One of the examples was a pair of groups of 32 contiguous IP addresses.
Each of the groups of 32 machines – as that is what they are – comprises machines connecting to a single application. The Platform Name is filled in – via the JDBC driver in this case – so I know the application name. Actually the Platform Name is not constant in this set of data but follows a clear naming convention.
Before I go on, I should say contiguous IP addresses aren’t necessary for this method; Just the naming convention. But contiguous IP addresses suggests a battery of machines deployed at the same time.
The Thought, Such As It Is
So, I got to thinking: If these really are batteries of middle-tier machines we can perform statistical analysis on them.[4]
Some people might be confused by the term “battery”; I’m appealing to the original meaning – as in “gun battery” rather than the thing you lick to get a tingle on your tongue. 🙂
<<Serious Face Back On>>
Pro Tip
I modified my code in the following way:
- I changed the DFSORT step that produces the raw file the REXX formatting step reads to a CSV file. This is very easily accomplished.
- I modified the REXX step to expect CSV, not just fixed-position fields. Again, easy to do.
The “pro tip” is this: When passing a transient file consider if it wouldn’t be more useful to pass a CSV file. There is no need to squeeze any of the fields to get rid of blanks. Not squeezing is handy for any downstream DFSORT or ICETOOL processing.
I loaded the CSV file into Excel (which I actually find frustrating to use).
I then created graphs to show the CPU seconds of Class 1 time occasioned by each machine in the battery.
A Nice Test Case
So I took 3 hours of a customer’s data for a 4-way DB2 Data Sharing Group. For simplicity in what follows I’m only showing a single DB2 subsystem’s view.
In this example there were two batteries of 16 machines each. These are Websphere Application Server (WAS) machines, handling part of the customer’s Mobile[5] workload.
I’m led to believe these two batteries of servers are meant to be balanced. So I would expect – certainly over the 3-hour interval – the Class 1 CPU in DB2 to be balanced. So look at the following two graphs:
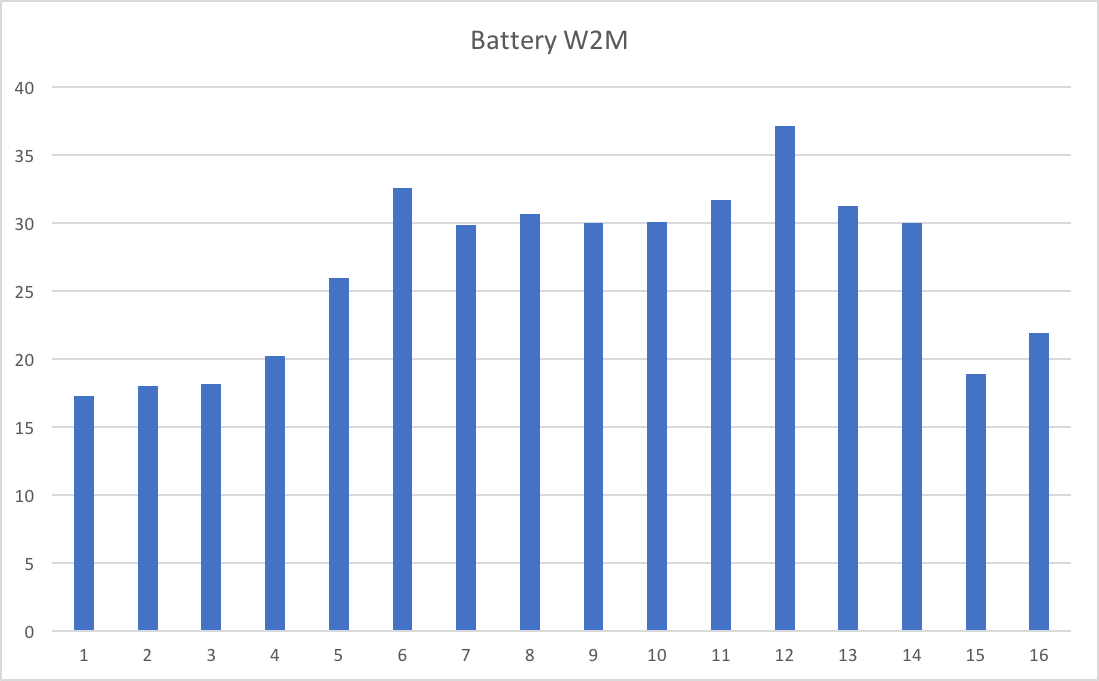
This is Battery W2M.
And the following is Battery W3M.
src=”https://mainframeperformancetopics.com/wp-content/uploads/2020/01/battery-w3m.png”>
Each graph has 16 bars. Each bar is DB2 Class 1 CPU seconds in the 3-hour data swag for a single WAS server.
So, there are a number of things to observe:
- None of these numbers is particularly large.
- The servers in a battery are not balanced. I think I observe the middle servers are busier than the ones at the edges – but I can’t explain that.
- The two batteries aren’t balanced. (I’ve ensured the scales on the two graphs are the same, before you check.)
Conclusion
I think we can do useful work this way:
- We can ask why the imbalance between and within batteries.
- We can – with a third dimension – see the behaviour of the battery with time.
- We can monitor at the machine and battery level – to understand when the workload is building up. Or – not the case in this example – if a machine is “beaconing”.
- We could – with adequate statistics from these machines [6] – correlate DB2 Class 1 CPU with middle-tier machine CPU.
So, the “rich vein” of DDF so-called insights continues. And this post is yet another example of stuff you can do with SMF to bring conversations with architects and others to life.
So now you know – if you send me 101s – another rabbit hole I’m likely to go down. 🙂
I’m finishing writing this on the train home from London; We had a very lively discussion on DDF (and a great meeting overall). Of course the two graphs in this post featured – and played as I thought they would.
One particular aspect seemed to gain traction: In DB2 DDF Transaction Rates Without Tears I wrote about SMF30ETC – Enclave Transaction Count in SMF 30.
The context was trying to work out which DB2 subsystems and which time frame to analyze SMF 101 from. While it might only be possible to get and process 15 minutes to 1 hour of data (particularly if you’re a consultant as I am) you want to time it right. SMF30ETC might very well tell you where to dig. Of course, without complete coverage you never know if some other piece of DDF work from some other timeframe was important. Oh well, you can’t have everything.
-
Get the literary reference in the title? 🙂 ↩
-
Old presentations never die’ They just get leggy and unprunable. 🙂 ↩
-
Does it make me a dinosaur to hate it when people say “blog” when they mean “blog post”? 🙂 ↩
-
Who knows what might be useful? “Suck it and see” is a good approach. 🙂 ↩
-
This seems to me quite a natural configuration – dedicated Mobile middle-tier machines. It also, using WLM DDF classification rules, fits into a Service Definition that helps with Mobile Workload Pricing. (I’m not, however, a Software Pricing expert.) ↩
-
Pardon my bias 🙂 but I think it’s tough getting decent middle-tier machine statistics. ↩

One thought on “A Tale Of Two Batteries”