This post follows on from my 2019 post A Slice Of PI. Again, not Raspberry Pi but Performance Index PI. 🙂
I’ve become sensitised to how common a particular Workload Manager (WLM) problem is since I created some handy graphs.
Some Graphs Recent Customers Have Seen
When I examine a customer’s WLM Service Definition part of what I do is examining SYSTEM Workload, and then successive importances.
(SYSTEM Workload is mainly SYSTEM and SYSSTC Service Classes, of course. And if these are showing a drop off in velocity you can imagine what is happening to less important work. This is when I consider Delay For CPU samples – to figure out how much stress the system is under. But I digress.)
By “successive importances” I mean:
- Graph importance 1 Performance Index (PI) by Service Class by hour.
- Graph importance 2 Performance Index (PI) by Service Class by hour.
And so on.
Sometimes there is little work at eg Importance 1, so I might stop after Importance 2 or I might not. (Service definitions vary in what is at each importance level – and I graph CPU for each importance level to understand this.)
The above approach gives me some orientation. And it has shown up a phenomenon that is more common than I had supposed: Percentile goals where the service class period ends up with a PI of 0.5.
The Top And Bottom Buckets
Recall the following from A Slice Of PI: For a Percentile Goal when an individual transaction ends its response time relative to the goal is used to increment the transaction count in one of 14 buckets. There are two buckets of especial interest:
- Bucket 1 – where transactions whose response times are no more than 50% of the goal time are counted.
- Bucket 14 – where transactions whose response time are at least 400% of the goal time are counted.
These buckets feed into the Performance Index (PI) calculation. Let’s deal with Bucket 14 first:
Imagine a goal where the goal is “85% in 15ms”. If fewer than 85% of transactions end with response times short enough to land them in Buckets 1 to 13 the PI is 4. We don’t have much clue as to quite how long the more than 15% in Bucket 14 took, but we know they all took at least 4 × 15 = 60ms. So we don’t know how much to adjust the goal by. (Of course, we might want to tune the transactions or the environment instead – and we don’t know how much to speed things up by.)
A note on terminology: I’m going to use the term goal percent for the “85%” in this example. I’m going to use the term goal time for the “15ms” part.
The Bottom Bucket
Bucket 14 was the “warm up act” for Bucket 1.
With our “85% in 15ms” goal a transaction ending in Bucket 1 has a response time of no more than 0.5 × 15 = 7.5ms. Again, we don’t know how close to the bucket boundary the transaction response times tend to be. Here are two possibilities (and there are, or course, myriad others):
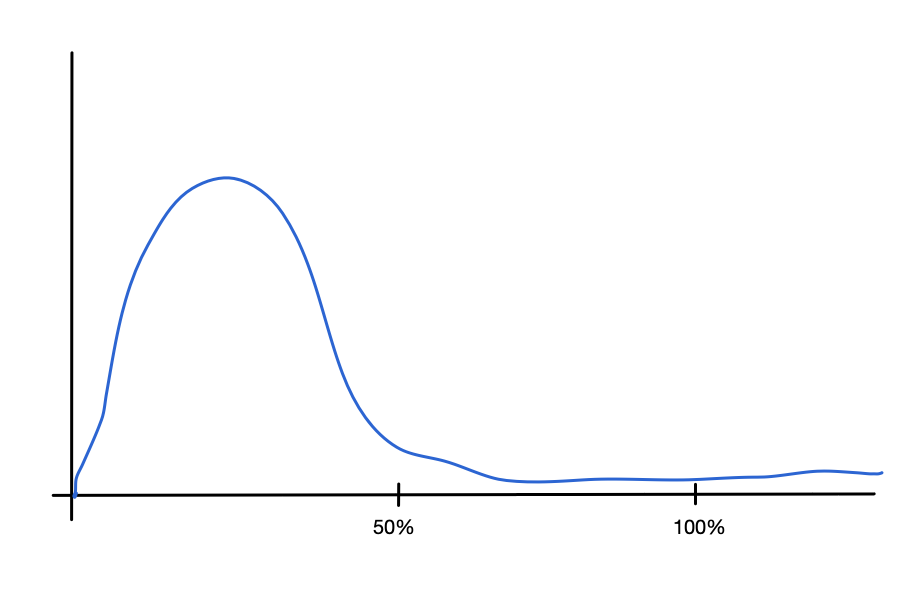
This first graph shows a transaction distribution where the transactions have response times tending towards way shorter than 50% of the goal time.

This second graph shows a transaction distribution where the transactions have response times tending towards just short of the 50% of goal time marks.
Both could have a PI of 0.5.
So what should we adjust the goal time to? I think we should be prepared to be iterative about this:
- Set the goal time to somewhat less than the current goal time. Maybe as aggressively as 50% of the current goal time – as that is safe.
- Remeasure and adjust the goal time – whether up or down.
- Iterate
I think we have to get used to iteration: Sometimes, from the performance data, the specialist doesn’t know the final value but does know the direction of travel. This is one of those cases, as is Velocity.
In most cases we should be done in a very few iterations. So don’t be unimpressed by a specialist having the maturity to recommend iteration.
An alternative might be to tighten the goal percent, say to 95%. This has a couple of issues:
- it tells us nothing about distribution.
- It is more or less problematic, depending on the homogeneity of the work. At the extreme, if all transactions have the same measured response time adjusting the percent is a blunt instrument.
Problem 2 is, of course, more serious than Problem 1.
Of Really Short Response Times
Really short response times are interesting: Things being really fast is generally a good thing, but not always.
Consider the case of JDBC work where Autocommit is in effect. Here every single trivial SQL statement leads to a Db2 Commit and hence a transaction ending. This can lead to extremely short response times. More to the point, it’s probably very inefficient.
(You can observe this sort of thing with Db2 DDF Analysis Tool and Db2 Accounting Trace (SMF 101).)
But transactions have become faster. It’s not uncommon for goals such as our example (85% in 15 ms) to be lax.
Faster against the expectations of WLM goal setters. In the DDF case it’s quite likely such people won’t have been told what to expect – either in terms of performance or how to classify the work. Or, fundamentally, what the work is.
I see a lot of DDF Service Classes with 15ms for the goal time. For many years you couldn’t set it lower than that. Relatively recently, though, the lower limit was changed to 1ms. I’m not suggesting a transaction response time of 1ms is that common, but single digit is increasingly so.
So this 1ms limit stands to fix a lot of goal setting problems – both for percentile and average response time goal types.
The analogy that comes to mind is 64-Bit: We don’t – for now – need all 64 bits of addressability. But we certainly needed many more than 31. We might not need 1ms right now but we needed considerably less than 15ms. (I would guess some technological improvement meant this became feasible; I really should ask someone.)
Why Is A PI Of 0.5 A Problem?
You would think that doing better than goal would be a good thing, right?
Well, not necessarily:
- Not what was contracted for
- Not protective
Between the two of them there is a Service Delivery hazard: When things slow down an overly lax goal won’t stop this work from slowing down. And this is where Service Level Expectation – what we’ve delivered so far – clashes with Service Level Agreement – what the users are entitled to.
I often like, when we have a little time in a customer workshop, to ask where the goal come from. Perhaps from a contract, whether internal or external. Or maybe it’s the originally measured response time. Or maybe it’s just a “Finger in the air”. This all feeds into how appropriate the goal now is, and what to do about it.
Walking This Back A Tiny Bit
It’s not hopeless to figure out what’s going on if everything ends in Bucket 1, with a PI of 0.5. You can – again from Workload Activity Report (SMF 72-3) data – calculate the average response time. If the average is well below the “50% of goal time” mark that tells you something. Equally “not much below” tells you something else.
So, I think you should calculate the average, even though it’s not that useful for goal setting.
Conclusion
You probably know I’m going to say this next sentence before I say it: Revisit your WLM Service Definitions – both goal values and classification rules – on a regular basis.
And, now that I have PI graphs for each importance level, I’m seeing a lot of “PI – 0.5” situations. Hence my concentrating on the bottom bucket.
One final thing: With Db2 DDF Analysis Tool I am able to do my own bucketing of DDF response times. I can use whatever boundaries for buckets I want, and as many as I want. This helps me – when working with customers – to do better than the “14 buckets”. Or it would if I weren’t lazy and only had 10 buckets. 🙂 I can do the same with CPU time, and often do.
Hopefully this post has given you food for thought about your percentile goals.

One thought on “Another Slice Of PI”