It’s possible I’ve written about this before. If so it’s been a while.
What I certainly have written about in the past is the SMF 30 Usage Data Section. I will have described how it can be used to describe architectural attributes of an address space or batch job. For example:
- That it really is a CICS region. (Not all CICS regions have program name “DFHSIP”.) And what its version and release is.
- That the address space ( or job) connects to Db2 or MQ – and which subsystem or queue manager in particular.
(I probably shouldn’t go on a rant about how important an appreciation of architecture is in many Performance and Performance-adjacent situations.)
But let me come to the point: You can sometimes get useful CPU numbers out of the SMF 30 Usage Data Section. This post is about experiences with those numbers. Consider it an experiment.
Usage Data CPU Numbers
Notice I didn’t call this section “SMF 30 Usage Data Section CPU Numbers”. That’s because SMF 89 also has some Usage-related CPU numbers.
- SMF 89 aggregates usage at the system level by product.
- SMF 30 aggregates usage at the address space level.
Both are available at the interval level. SMF 30 is, of course, available at the step- and job-end level.
Both provide Product TCB and Product SRB times. This is what the rest of the post is about – but from the SMF 30 perspective (which I personally find more interesting).
I should note that SMF 89 also has Product zIIP CPU – which SMF 30 doesn’t.
Playing It By The Numbers
I should note the only reason a Usage Data Section appears in the SMF 30 record is that the IFAUSAGE macro was invoked by the program.
First I would advocate summing the SRB and TCB numbers in the Usage Data Section by Product ID (or Name) and possibly Product Qualifier. The latter gets you the Db2 subsystem or MQ queue manager name, if relevant. Having done that you might well break out the large individual section numbers.
You might attempt to reconcile Usage TCB / SRB time with other metrics from the same SMF 30 record. I will note the numbers for a CICS region are pretty close – which makes perfect sense but isn’t terribly interesting.
The numbers for MQ and Db2 tend to be substantially smaller – which again makes sense. They do reflect actual usage.
Here’s a sanitised set of data.
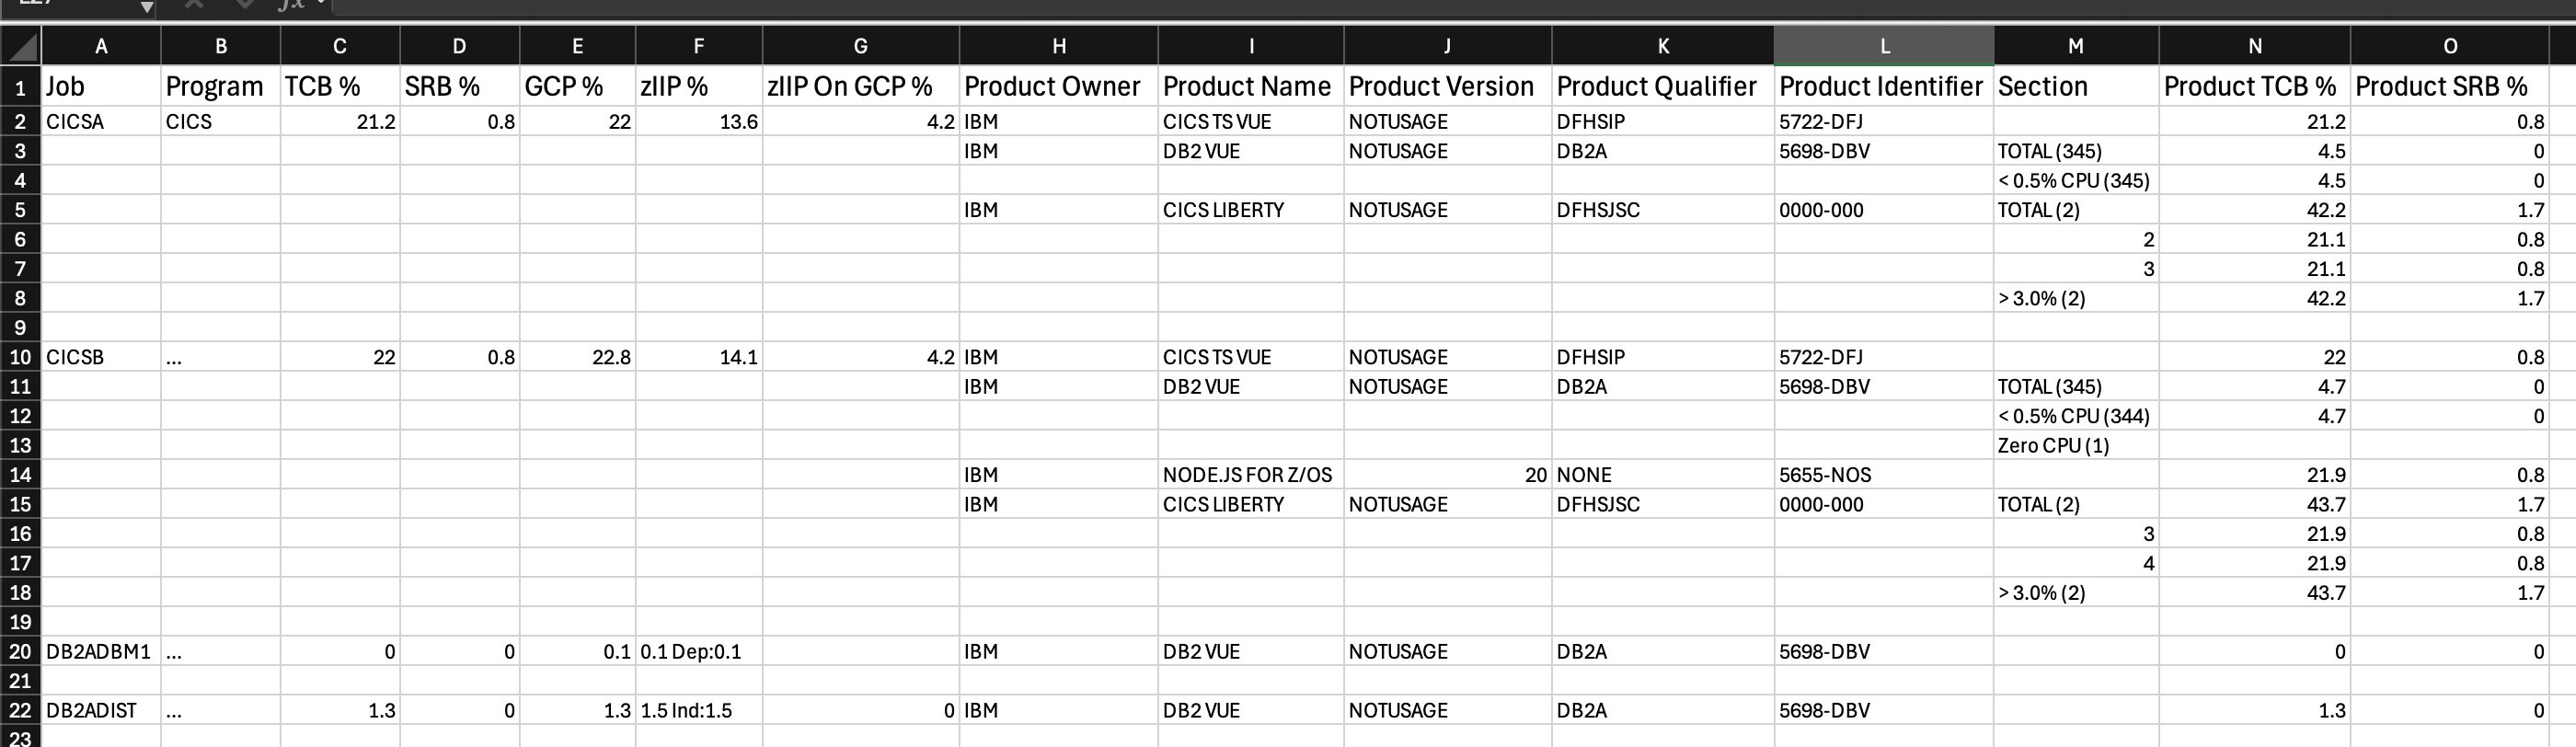
You will see counts of sections in Column M, along with some taxonomy. The percentage numbers are percentages of a GCP processor. (In this case the GCPs are full (z15) speed.)
I haven’t acquired useful explanations for the numbers of eg Db2 Usage sections. I’ve been waved off thinking they are concurrent Db2 thread counts.
A Caution On Db2
It is very often the case that Usage TCB / SRB is zero, except for the “Db2 Engine” address space. If this is so it’s because the installation disabled the function – in DSNZPARM. It’s said to consume CPU but I’ve seen no evidence this is substantial – so I consider this a pity.
More On Db2
This customer has enabled Usage Data to reflect Db2 usage, so the Db2 numbers for the 2 CICS regions are non-zero.
Looking at the 2 Db2 Engine address spaces we see a very small Db2 subsystem. The GCP numbers are tiny – in fact showing as 0 for the DBM1 address space. (It’s not really 0 but very small.)
The DBM1 address space has some zIIP time. This shows up as Dependent Enclave time – which is normal and reflects some Prefetch and Deferred Write activity.
The DIST address space has some TCB Usage – which agrees with the address space TCB time and the GCP time. The TCB time is Thread Establishment and Termination – which is never zIIP eligible . It’s also DDF application work. The zIIP time is all DDF application work.
Up to 60% of zIIP application work can be zIIP eligible. If we assumed that then the total application work would be 1.5 / 0.6 or 2.5% and so the non-zIIP portion would be 2.5 – 1.5 or 1.0%. The remaining GCP time would be 0.3% – for Thread Establishment and Termination.
Of course that 0.3% is a lower bound but it probably isn’t far off.
At this point I would say better work is done with Db2 Accounting Trace as well as SMF 30. But at least this has been a reasonable sanity check – without the need for the former.
Side note: IRLM is not Db2 and it doesn’t have any Usage Data Sections.
Recent Discoveries
I’m seeing many more instances of Liberty Profile (in CICS regions) and Node (not always in CICS regions). I would suggest these appearing is a useful piece of taxonomy, Furthering the “Architecture” cause.
You’ll see both of these in the CICS Region example.
You’ll notice in both cases large TCB numbers. (Sections 2 and 3 in the first case, and 3 and 4 in the second.)
When you look at them each section’s TCB and SRB numbers are about the same as for the whole address space and also the CICS section’s number. There is a clear danger of double counting here, so be careful. Clearly the same CPU is being recorded more than once.
The same number appearing more than once does not, however, lead to double charging for software.
Both Node and Liberty are well known to use zIIP, which you see documented in Columns F and G.
The address space TCB and SRB numbers are GCP numbers – and it’s those that are reflected in the Usage numbers. CICS itself is all GCP.
Conclusion
There are TCB and SRB numbers in the SMF 30 Usage Data Section – that can help you understand more about the address space or region.
This experiment has shown that the way the Usage Data Section numbers appear is complex. Specialist instrumentation from Db2 or CICS or MQ or IMS is probably better, alongside SMF 30. But those might not be available; Sometimes SMF 30 and RMF is all you have.
Still, it’s been fun looking at this.
Making Of
I started writing this on a flight to Istanbul – where I met lots of customers. I’m finishing it off on the way back. This post has been on my todo list for a long time, possibly years. I don’t even remember what the original intent was. The acronym DRY (“Don’t Repeat Yourself”) is often used. In this case I might have fallen foul of it – but I probably have something different now to say than what I might’ve said before. Such brings experience.
I would also note this line of enquiry has caused some tweaks to my Usage Data reporting code. I’m open minded enough to think there might be more to come. In fact the tweaks aren’t for the Usage Data Section itself, but rather adding zIIP and GCP numbers – to help illuminate the Usage numbers.
Im using the Apple Pencil and this time it / I seem(s) to be behaving fairly well. It could be I’ve got better or maybe the smoothness of the flight. Of course technical terms are still a challenge; iPad OS doesn’t expect them at all.
 Mainframe, Performance, Topics
One thought on “Product CPU Usage – A Sometimes Useful Metric”