Hackday 9 – REXX, Java and XML

(Originally posted 2011-10-10.)

I’ve written about Hackday in the past. See My HackDay 6 Project – Mashing Up RMF, My HackDay 5 Project – z/OS System Logger Analysis and Hackday4 and Referer URLs (though I don’t know why I didn’t write about Hackday 7 or Hackday 8).

So, this year I participated in Hackday 9 (last Friday). My entry follows on from this recent blog post: BPXWUNIX – z/OS’ Best Kept Secret?. Graham Harris, in his comment, mentions using java to process XML (albeit with issues with the XML generated by RMF, caused by the 2048 byte record limit of BPWUNIX). I’d been thinking along similar lines, though not RMF output specifically.

So my entry has at its core a java program that uses standard functionality to process XML. In particular I pass a filename and an XPath expression in to the java program and it returns the results of evaluating the expression. I intend it as a sample, rather than a really useful program – but I think it COULD be used.

I call the java program from REXX using BPXWUNIX. There is a wrinkle here. I’d not realised it before but you can pass in environment variables. Here’s the REXX:

/* REXX */ 
                                                                    
/* Set up environment - else java executable can't be found */ 
env.0=1 
env.1="PATH=/bin:.:/usr/lpp/java/J5.0/bin:." 
                                                                    
/* No standard input lines in this case */ 
stdin.0=0 
                                                                    
/* XML file name */ 
ifn="test4.xml" 
                                                                    
/* XPath expression to evaluate */ 
XPathExpression="//book[author='Neal Stephenson']/title/text()" 
                                                                    
/* Execute java program with XML file name and XPath expression */ 
cmd='java XPathEvaluator.class' ifn '"'XPathExpression'"' 
call bpxwunix cmd,stdin.,stdout.,stderr.,env. 
                                                                    
say "stdout:" 
say "=======" 
do i=1 to stdout.0 
  say i stdout.i 
end 
                  
say "stderr:" 
say "=======" 
do i=1 to stderr.0
  say i stderr.i 
end 

Apart from the "env" lines at the top (and the extra parameter to BPXWUNIX) and the java command this is exactly the same as code as in BPXWUNIX – z/OS’ Best Kept Secret? and so needs no explanation.


Here’s the XML file we’re processing, so the XPath expression makes sense.


<?xml version="1.0"?> 
<inventory> 
  <book year="2000"> 
    <title>Snow Crash</title> 
    <author>Neal Stephenson</author> 
    <publisher>Spectra</publisher> 
    <isbn>0553380958</isbn> 
    <price>14.95</price> 
  </book> 
  <book year="2005"> 
    <title>Burning Tower</title> 
    <author>Larry Niven</author> 
    <author>Jerry Pournelle</author> 
    <publisher>Pocket</publisher> 
    <isbn>0743416910</isbn> 
    <price>5.99</price> 
  </book> 
  <book year="1995"> 
    <title>Zodiac</title> 
    <author>Neal Stephenson</author> 
    <publisher>Spectra</publisher> 
    <isbn>0553573862</isbn> 
    <price>7.50</price> 
  </book> 
  <!-- more books... --> 
</inventory> 

In the XPath expression we look for the text in the title element of each of the book elements whose author element’s value is "Neal Stephenson". (I got this XML and much besides, by the way, from The Java XPath API – Querying XML from Java programs. The result of evaluating the expression is:

stdout:    
=======    
1 Snow Crash
2 Zodiac   
stderr:    
=======    

and this is because only two of the book elements match the [author="Neal Stephenson] condition.
 
The java to drive this is:


import java.io.*; 
                                                                    
import org.w3c.dom.*; 
import javax.xml.parsers.*; 
import javax.xml.xpath.*; 
                                                                    
public class XPathEvaluator{ 
                                                                    
  public static void main(String args[]) throws Exception{ 
    DocumentBuilderFactory dbf=DocumentBuilderFactory.newInstance();
    dbf.setNamespaceAware(true); 
                                                                    
    DocumentBuilder docBuilder=dbf.newDocumentBuilder(); 
                                                                    
    Document doc=docBuilder.parse(new FileInputStream(args[0])); 
                                                                    
    XPathFactory xpf=XPathFactory.newInstance(); 
    javax.xml.xpath.XPath xp=xpf.newXPath(); 
                                                                    
    XPathExpression expr=xp.compile(args[1]); 
                                                                    
    Object result=expr.evaluate(doc,XPathConstants.NODESET); 
    NodeList nodes = (NodeList) result; 
     for(int i=0;i<nodes.getLength();i++) { 
       System.out.println(nodes.item(i).getNodeValue());
     } 
   } 
 } 

This is also largely described here.

So you have the sample REXX, java and XML to play with. A couple of things I would note:
 

  • There is only one pair of "boundary crossings" between REXX and java – which is, I think, goodness.
  • Because the XML parsing is done in java (through XALAN-J) I expect this to be very largely zAAP-eligible. Another nice characteristic.


 One final thing: If you search in my blog you’ll see I mention XPath in Workload Manager Policy in XML Format – Part I

and Workload Manager Policy in XML Format – Part III.


Happy hacking!

zAAP and zIIP Delay

(Originally posted 2011-10-01.)

I was going to start this post with an apology. But, as any sensible blogger would, I left it a few days to write this. Now I realise that there’s a wider point than the "I was wrong" one. (But I was wrong – in a way that I think many other people might’ve been wrong too.)

So let me talk about two things in this post:

  • zAAP and zIIP Delay.
  • How I came to be wrong and what we can all learn from it.

zAAP and zIIP Delay

The fields we’re talking about here appear on the RMF Workload Activity Report and are – in the Type 72-3 record – R723IFAD (for zAAP) and R723SUPD (for zIIP). Personally I use the latter as shown in zAAP and zIIP Revisited (At Last).

They are described as "zAAP delay samples" and "zAAP using samples".

(Hereafter I’m going to drop the "or zIIP" bit. And, by the way, zAAP-on-zIIP doesn’t affect the discussion significantly.)

But what does R723IFAD mean? I had assumed (perhaps mentally fuzzily) that it meant "delay samples because zAAP was unavailable" (likewise zIIP). So my recommendation would have been that the way around it was to provision more specialty engine capacity to the service class period.

It turns out that’s not the right interpretation of the field. Here’s a better one:

For a delay sample to be declared for a service class period for zAAP all of the following criteria have to be met:

  • We were trying to run zAAP-eligible code. (I think we knew this.)
  • No zAAP could run the work. (My basic assumption.)
  • No general-purpose engine (GCP, in my parlance) ran the work. (This is the new bit.)

So, seeing significant samples in the "Delay for zAAP" field means we not only didn’t get to run on a zAAP but we also didn’t run on a GCP. And the implication here is that understanding all this requires us to weave in the GCP view. We could be short on both zAAP and GCP capacity.

Now, I would guess the "take home" is still provision more zAAP capacity to the service class period – if you want to increase its velocity and Delay for zAAP is the major issue. (There are some rare cases where that mightn’t be right – given processors come in integer numbers.) But the reasoning is a little different: You’d rather run zAAP-eligible work on a zAAP than on a GCP, I would think.

For completeness, the "CPU Delay" field (R723CCDE) is for non-zAAP-eligible work and "CPU Capping Delay" (R723CCCA) is also for non-zAAP-eligible work. (Helpfully the SMF manual states that R723CCCA is not a subset of R723CCDE.) If R723CCDE / R723CCDE come into play, then, it’s about provisioning GCP capacity – or, distantly, finding a way to make more of the work eligible for zAAP.

The Wider Lesson

We’re all used to reading numbers off reports and taking them at "face value". If some metric is called "splodgeness" and the value is high we say "splodgeness abounds" :-) without necessarily giving it too much thought. But what is this "splodgeness" whereof we speak?
Often all we get is the description "zAAP delay samples." (If you think we get more then do please look at the SMF manual’s description for R723IFAD.) So we tend to:

  • Cling to the certainty the existence of a particular metric gives us. I think we’re grateful to have the metric. After all, consider the counterproposition.
  • Invent for ourselves an interpretation of what the metric means. I say, perhaps rudely, "invent" because who’s to say if we have the right interpretation? We have to gain a foothold somehow. So actually I’m entirely sympathetic.

So, in response to a customer question I set off in search of an answer to the question "what does R723IFAD mean?" I have a friend in RMF who mentioned they got the number from WLM and suggested I ask a mutual friend in WLM. He, very usefully, pointed me at Dan Rosa in Systems Software Development in Poughkeepsie. Dan and I chatted for well over an hour and he helped form a very good understanding of what this field means. So many thanks to Dan!

Now, I count myself as very lucky in having friends in such useful places. I realise that’s a privilege. And I don’t tend to bombard them with questions about each and every SMF record’s field.

So, I think there are lots of fields like that. I’ve stumbled across a fair few. It would be nice to revive the old RMF Field Description manual (last updated in the early 1990’s). I don’t think that’s going to happen, unfortunately. And it would take forever to bring it up to date.
 
But I do think it’s legitimate to gain an understanding of where a field came from, why it was invented, and how it behaves. And that’s what I try to do – for fields I think tell a useful story. And that’s part of why I actually like questions about fields, and part of why I feel like a "kid at Christmas" whenever new data arrives: It gives me a chance to see how this stuff behaves and how y’all’re using our hardware and software.


So, in conclusion, we learn and grow together. But there’s always room for better understanding. I guess I knew all this. Tacitly, I expect a lot of you will share my experience.

BPXWUNIX – z/OS’ Best Kept Secret?

(Originally posted 2011-09-27.)

Maybe you’ve all heard of BPXWUNIX. Maybe it’s just me that hasn’t. Hence the question mark in the title.

Seriously, I doubt this REXX function is as widely known about as it should be. And this post hopes to illustrate a little of its value.

Suppose you’re writing a REXX program with a stem variable in it. Suppose you want to sort the strings in the stem variable:

  • You might write your own sort routine. Not terribly difficult but a little fiddly.
  • You might write it to a temporary file, do some dynamic allocation and call DFSORT, reading back from another temporary file. (I did that in something I called "NICETOOL" a long time ago.) This also is fiddly.

or you might want to try the BPXWUNIX approach…

BPXWUNIX is a very nice REXX function. It allows you to pass the contents of a stem variable to a z/OS Unix program and to return the results in two more stem variables. In a little more detail:

  • The first parameter is a Unix command string.
  • The second parameter is a stem variable where .0 has the count of the number of lines. This is stdin.
  • The third (optional) parameter is another stem variable where each item is a line of stdout.
  • The fourth (optional) parameter is, likewise, stderr.

Anyone familiar with Unix will know about stdin, stdout and stderr.

Now, there is a standard Unix sort program. This bears little resemblarnce to DFSORT. But that’s not the point. Consider the following program:


/* REXX */ 
stdin.0=5
stdin.1="KIJJ"
stdin.2="KQWR"
stdin.3="ADGF"
stdin.4="OEPE"
stdin.5="VNVV"
                                       
cmd="sort"

call bpxwunix cmd,stdin.,stdout.,stderr.
                                       
say "stdout:"
say "======="
do i=1 to stdout.0
  say stdout.i
end
                                       
say "stderr:"
say "======="
do i=1 to stderr.0
   say stderr.i
end

The highlighted lines are the most interesting ones. Between them they execute the Unix sort command, marshalling stdin, stdout and stderr. The lines before set up the strings to be sorted and the ones after print the results. (You could source the strings and deal with the results any way you wanted.)

So this is quite simple. If you want to know more about sort go here (for example).

The simple command "sort" without parameters sorts the records alphabetically – based on each record’s entire contents. That may not be what you want. So, without regurgitating the manual:

  • There are numerous parameters that control the sort – on the Unix side.
  • You might be able to help yourself by "packaging up" the data on the REXX side appropriately.
  • You might want to pipe the data into or out of the sort with other Unix commands.

Of course, in this post sort is just an example. There are lots of Unix commands that could do things more easily than REXX could. And this might help along programmers who are primarily used to Unix.

I’m not sure, by the way, that continual crossing of the boundary between REXX and Unix commands is the highest performing thing to. But in this case we only do the round trip once. I’ve not done any performance tests but it seemed to be OK. I suspect that calling grep on a single line of data continually would perform well. But that’s an extreme case.

What I fancy doing – when I get the time – is experimenting with the ideas for XML parsing here.

One limitation you should be aware of is that lines can only be up to 2048 characters long. Ordinarily that wouldn’t be a problem – except for processing SMF. (Not that REXX can directly read SMF anyway. The standard dodge is to copy the VBS data to a transient VB data set and then process it with REXX.)

Any other examples of using BPXWUNIX you’d care to share?

Batch Capacity Planning, Part 2 – Memory

(Originally posted 2011-09-25.)

I can’t believe it’s been almost a week since I wrote Batch Capacity Planning, Part 1 – CPU . Where did the time go? 🙂

Re-reading it I’m struck by the overwhelming theme of Batch’s unpredictability and lumpiness. This is true of memory, as well, but to a much lesser degree.
 
Why to a lesser degree? Well, in most systems I look at the memory usage is mostly fairly constant and dominated by big "server" address spaces (such as DB2) or else CICS regions (and the analogue in the IMS world). So the variability of the Batch workload is overshadowed by the constancy of these other address spaces.

I oversimplified there just a tad. for example:

  • A few customers alter their DB2 buffer pools  – using the, unsurprising, ALTER BUFFERPOOL command. (They increase the size and sometimes change the various thresholds, particularly if they perceive Sequential processing to dominate overnight.)
  • Many customers shut down some, if not all, of their CICS regions overnight. Decreasingly so, though. Likewise IMS MPRs.

But these changes are step changes and conscious acts of will. Do take them into account, but don’t worry about their variability.
 
But there’s an issue anyway with Batch memory analysis:

  • At the System level RMF reports good numbers: The various frame queues and Available Frames are all accurate in SMF Type 71
  • At the Service Class level (SMF Type 72) the numbers are less reliable: We use R723CPRS (Resident Page Frame Seconds) to figure out how much memory a service class (period) is using. This works fine for Non-Swappable work (such as CICS and DB2 and System). It doesn’t work well for Swappable work (such as TSO and Batch): When you’re logically swapped you’re said not to accumulate (memory) service. So Swappable work is under-counted.

This has been such a nuisance that my standard Memory graph has to take it into account: I take the Online frames and subtract all the non-workload frame queues – LPA, CSA, SQA and the like – and the Available Frames. These all come from SMF 71. What’s left ought to be workload-related memory usage. So I then subtract all the memory usage (R723CPRS-driven) for all the workloads – including Batch and TSO. What’s left I call "Other".

For the most part Other is the under-representation of Swappable workloads –  Batch and, distantly, TSO. But I sometimes see a veneer of constancy – which could be a miscalculation or another category of memory entirely. But at least I can add "Other" into the Batch workload to get a reasonable estimate.
 
What I do note is that, generally, there’s lots of memory in the Available Frames category i.e. Free – during the Batch Window. So it’s almost always true that – from the Memory perspective – Data In Memory (DIM) or Parallelism could be increased.

I find the SMF Type 30 data to be almost entirely useless for memory usage purposes – especially for Batch. About the only thing you can do with it is to use the Virtual Memory fields and pretend that each virtual page allocated is backed by real memory. Which we all know to be a (usually) gross overestimate.So I don’t actually do that.

For Batch, though, the biggest user of memory is typically DFSORT. Now there we have good news: The instrumentation does a nice job of summarising peak memory exploitation: Whether Dataspace, Hiperspace or Large Memory Object sorting. Note: I say "Peak" here. You might be able to do something to turn that into an average. But that would be a little fraught.

All the above has been about actual usage. What about projecting forwards? If you know nothing’s going to change the picture is likely to be static. If you think you’re going to exploit DIM or Parallelism it’s much more difficult, for the same reasons as it was for CPU. But there’s an additional reason:
 
If you were to be very successful at buffering something – especially with only a small number of buffers – then you hold onto the memory for less time. By exploiting DIM well the "area under the curve" could actually go down. Such a case might be using VSAM LSR buffering. I’ve seen the kinds of speed up where this is likely: 2 million I/Os to under a thousand, for example.

So, in summary, Memory Capacity Planning for Batch shares the difficulties of CPU. But it also has a few of its own.

Batch Capacity Planning, Part 1 – CPU

(Originally posted 2011-09-19.)

It’s been a week since the following was posted in IBM-MAIN: Batch Capacity Planning – BWATOOL? So far there’s been no reply. Though a little disappointed, I’m not surprised. "Disappointed" as I was looking for a good debate (even though it wasn’t me who asked the question). "Not surprised" as I think the subject of Batch Capacity Planning is a tough one. The original post prompted me to think about posting on the subject. I think I’ll do it in two parts:

  1. CPU
  2. Memory

An obvious place to start is by comparing and contrasting Batch with Online, from the Capacity Planning point of view. This, of course, builds on the Performance / Window perspective:

  • Online comprises discrete (maybe discreet) 🙂 pieces of work, seemingly unconnected. Batch work – at least the stuff we tend to care about – is a network of inter-related pieces of work.
  • Online pieces of work (transactions) are brief relative to any summarisation interval you’re likely to use. Batch jobs, while many are very short, are often long compared to an interval. Although I’ve seen windows where the jobs are at most 15 minutes most Batch has key jobs in it that are much longer than this (the standard RMF) interval.
  • Online transactions (and their kin) are "scheduled" by being requested. Production Batch tends to be kicked off by a scheduler. (The "and their kin" parenthetic comment refers to the fact that many workloads are transaction-like, such as many styles of DDF requests.)

Those contrasts aren’t exhaustive but they are enough. We’ll use them to inform the rest of this post.

But there is a similarity that’s worth articulating: For both Batch and Online "enough CPU" refers to "what gets the job done": If Online work fails to meet Service Level Agreements / Expectations / Pious Hopes 🙂 or whatever you conclude something has to be done. Similarly, if important Batch fails to meet its business goals there’s pressure to do something. (This post isn’t going to go into the business drivers or the shape of SLAs.)

When I look at the CPU Utilisation for a Batch Window I typically see a huge amount of variability, both within the night and from night to night. This, I surmise, is caused by the "big lumps" characteristic above. And if you try to figure out which job caused a spike it’s hard to do automatically – because of the "interval straddling" characteristic above. But usually it’s fairly obvious – if the number of jobs running is not too large – which job is likely to have caused a spike.

 It also helps if you have a decent WLM Batch service class (and, hopefully, reporting class) scheme: You can identify which service class caused the spike. And thence the list of candidate jobs could be shorter.

WLM setup helps in another way: Assuming you have a sensible hierarchy of Batch service classes you can establish whether the supposedly-more-important jobs’ service classes are experiencing delays for CPU (from the WLM delay samples in RMF). With this view you can take a "squint at the picture" * approach – smoothing out the spikes to some degree. In fact summarising over a longer interval than you might normally could be useful.

I think you have to accept that some degree of delay is inevitable at times with spiky work like Batch. Even for the "top dog" Batch service classes. The question is "how much?" If you calculate WLM velocity for these service classes over a long enough interval and the work of the window is just completed, maybe that’s a useful metric and threshold. When the velocity drops below a certain level the window’s work might just fail to get done in time.

I appreciate the previous paragraph is a little vague: It’s trying to impart an approach to learning how your Batch works – from the CPU perspective. The "inevitable at times" phrase might be a little controversial: Certainly if your Online day drives the CPU capacity requirement you stand less of a chance of seeing CPU delays of any note in the Batch. But for many installations that’s not true: The Batch drives the CPU requirement (or, in some cases, drives the Rolling 4-Hour Average and hence the software bill).

I haven’t used the "job network" characteristic in this post yet. So here are a couple of areas I think it plays in:

  • It stands to move the spikes around: When a job gets elongated or delayed things move in the window. That could be the job itself being extended or downstream jobs being delayed.
  • Growth is as likely to express itself in  delays to jobs’ starting and completion as in increasing CPU requirements. Growth is mainly about "more data", though Development might add function so each input datum "gets more attention". 🙂

These two are related, I think. And they’re both about topology.

A couple of other things:

  • Given the complexity of Batch it’s very difficult to predict what the effect of tuning is – on either run times or capacity requirements.
  • It’s also very difficult to figure out how the "more engines or faster?" debate plays. "More and faster" is a clear winner (or at least non-loser). Some parts of the night will favour more. Some others will favour faster. Again the "squint at it" * technique is reasonable: If generally the answer is more, though sometimes it’s faster, probably more wins out. But apply common sense: Optimisation in one place causing de-optimisation in another requires care.

 I’ll admit this whole area is a tough one. I’d be interested in what customers do for Batch Capacity Planning – or indeed whether it drives their overall plan.

And soon I’ll write about Memory from the Batch Capacity Planning perspective.


* When I say "squint at it" I mean "use a technique that takes the spiky detail out, leaving an overall (if blurred) picture. I’ve used the term for many years. People don’t look at me oddly when I say it so I assume they know what I mean. 🙂  

zAAP and zIIP Revisited (At Last)

(Originally posted 2011-09-14.)

It’s been an awfully long time since I wrote When Good Work Doesn’t Go To zIIP / zAAP Heaven. And too long since I posted anything at all. 😦 In fact I had a bunch of posts in my brain until this morning when a customer asked me a question which turned into this blog post. (Those posts are still in my brain and will probably see the light of day eventually, including one based on a customer question.)

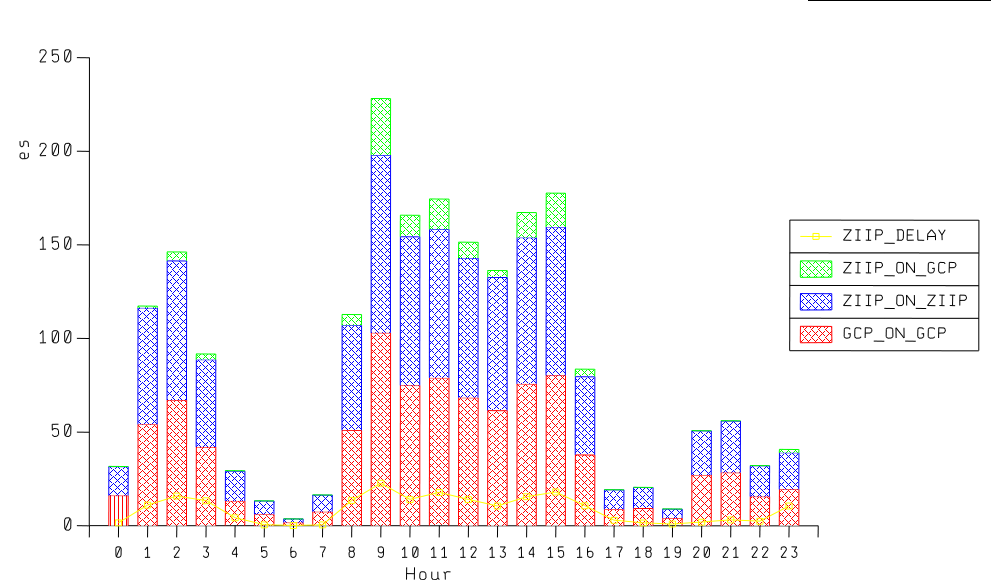
They wanted to know whether there was an In-And-Ready count for zIIP or zAAP. I don’t see such a thing. But what I do see is, in my opinion, much better. I’ve also presented a chart in my "Much Ado About CPU" presentation on the subject for some time now. I’m surprised I haven’t blogged about it already. So here it is, while it’s still useful: 

Take a look at this graph:

It’s for a single WLM Service Class period across a 24 hour period. On the vertical axis we have a couple of mixed types:

  • A stack of the CPU components for the service class period, as a percent of an engine. These are the bars.
  • A yellow line representing the percentage of WLM samples that represent zIIP delays.

In this example it’s a relatively benign case. Here’s how I read it:

  • The red bar values are "GCP on GCP" – the work that was never eligible for zIIP. It’s normal for it to run this way.
  • The blue bar values are "zIIP on zIIP" – the work that was eligible for zIIP that actually ran on zIIPs. This is goodness.
  • The green bar values are "zIIP on GCP" – the work that while eligible for zIIP ran on GCPs. This is what you’d like to minimise.
  • Because almost half ran on GCP I conclude this is DDF work. (In fact it running on a zIIP before zAAP-on-zIIP and the name of the service class confirm this. The regularity of the pattern and split also corroborate it.)
  • At times when the delay samples tick up so does the "zIIP on GCP". This is the key correlation.
  • In fact the "zIIP on GCP" portion isn’t all that bad. I’ve seen worse and I’ve seen a little better.

This is a standard part of my reporting. Hence I’m in a position to say "I’ve seen worse and I’ve seen a little better." I have experience these days. 🙂


Some observations:

  • It’s probably fair to use normalised CPU – particularly as there are many machines where the specialty engines run at full speed and the general purpose ones don’t.
  • It’s probably a good idea to add in the "Delay for GCP" sample percentage. I was sensitised to this by a customer both of whose pools were – for the service class period in question – showing serious delay samples.
  • In general this chart has both zIIP and zAAP on it for the same service class period. The technique works for zAAPs, zIIPs and zIIP on zAAP just the same.
  • Talking of zAAP on zIIP: I expect the numbers to all look like zIIP: There are no specific zAAP on zIIP metrics.
  • This technique allows you to evaluate things like IFAHONORPRIORITY and IFACROSSOVER as they work out at the service class period level.
  • The PROJECTCPU mechanism only works for workloads that are already running. For example, turning on IPSEC is a fresh workload: It won’t show up until you run it (whether on a GCP or a specialty engine).
  • If an exploiter changes how it behaves (for example DB2 DDF with PM12256) you’ll see some clues in this chart. I say "some" because in that particular APAR the variability in outcome at the thread instance level is not going to show up here. It might show up in DB2 Accounting Trace (SMF 101) if you go looking for variability at the individual SMF record level.

I think the graph works well (even if the colours etc don’t)  and I think it’s a chart you can replicate and build on (including the customer who asked the original question).

One final (meta) point:  I hope that if you ask me a question that’s of wider interest you won’t mind me posting the answer (perhaps extended) as a blog post like this. Of course I’ll shoot you the link. And, as you’ve seen in the past, of course I’ll avoid posting your data – unless you OK me doing so.

Setting Arbitrary Variables In A REXX Procedure That Persist After It Completes

(Originally posted 2011-08-23.)

Over the weekend I decided to try my hand at writing a JSON parser in REXX. I developed the technique outlined in this post to enable me to do that. I think it’s new. Certainly I’ve not seen it before.

(I don’t want at this point to get into a discussion about why JSON parsing might be a useful thing to do. Suffice it to say it is possibly going to be second only to XML as a common data format in the future.)

Consider the following code:

/* rexx */ 
stem="mystem" 
call setvars stem 
say "MYSTEM.A="mystem.a 
say "MYSTEM.B="mystem.b 
exit 0 
                             
setvars: 
parse arg stem 
interpret setvars2(stem) 
return 
                             
setvars2: procedure 
parse arg stem 
return stem".A=1;"stem".B=2;"

Here’s the problem it’s illustrating a solution to: I want to call a routine that sets arbitrary REXX variables but otherwise doesn’t create any side effects.

You’ll notice the “procedure” in the setvars2 routine that avoids the side effects. That’s pretty standard, actually. But it doesn’t allow any variables to be set. And I need them set.

So I return a string from setvars2 to setvars containing assignment statements. In this case the string is “MYSTEM.A=1;MYSTEM.B=2;” and it’s immediately executed – using the interpret statement.

The setvars routine (as you’ve probably guessed) is a wrapper. While it doesn’t use procedure – as I want the variables it sets to persist – it’s pretty clean: To the caller it appears clean, anyhow – as they oughtn’t to notice setvars2 that’s doing all the work.

There’s one fly in the ointment: The variable called “stem” gets set. I consider that a minor untidiness. If you, dear reader, know of a way of removing it I’d be interested in hearing it.

So it is possible to set variables in a routine that’s otherwise protected by procedure. You’ll notice that the variables that can be set are bounded by the stem passed on.

Seasoned REXX programmers are likely to think that expose solves the problem. Actually it doesn’t 😦 : I simply don’t know what the variable names will be and expose won’t take a string I could build. I thought about that and tested it.

You’re probably still wondering about my motivation: In the actual JSON parsing code you have to handle nested structures. So my equivalent of setvars2 calls itself recursively, passing back up a string containing assignment statements, separated by semicolons. These strings are appended to each other and the interpret in the equivalent of setvars indeed executes them.

We’re talking about resulting strings like:

"s1.a=1;s1.b.c='Hello';s1.b.centre.x=-5;s1.b.centre.y=22;"

which would come from a JSON string:

{
  "a":1,
  "b":
  {
    "c":"Hello",
    "centre":
    {
      "x":-5,
      "y":22
    }
  }
}

One of the issues here is knowing which variables got set – as we don’t know the JSON in advance (for certain). The way I can see that being handled is to set a “dictionary” variable containing the names we gathered up along the way. And then we get into the question of JSON Schemae – which I don’t intend to discuss at all here.

And the reason for mentioning all this is that I can see the technique has a wide range of applications. For me it certainly gets around a thorny problem involving recursion.

And no, it wasn’t the highlight of my weekend: Probably that was Walkway Over The Hudson which I’d wanted to do since long before it opened 2 years ago.

Another Graph I’m NOT Going To Share With You – Batch Window Reduction Expectations

(Originally posted 2011-08-12.)

In WLM Velocity – "Rhetorical Devices Are Us" I mentioned a graph I wasn’t going to publish – essentially to protect a customer. In this post I’m again going to describe a graph I have (at least in my head) without publishing it. (And for essentially the same reasons.) I hope you find it useful, however:
 
I’ve been acquainted with a lot of customer Batch Window Reduction projects, especially in the past two years. When I hear of a new one I "plot" the situation on the "graph in my head". So, if I tell you that what you’re trying to do is likely to succeed (or conversely that it isn’t) that’s (mostly) where it’s coming from.
 
So, about that graph:
 
  • On the x axis I plot the degree of scale up you’re trying to achieve. So, I might talk about "2X" or "1.3X".
  • On the y axis I plot how much time you have to achieve that in. Which might be as little as "by next month end" (no really!) or "within the next 2 years".
 
You can probably guess what’s coming next:
 
If you are trying to achieve a big scale up (say 5X, to quote a real recent case) in not much time (say 3 months, thankfully not the same case but nonetheless a real value) then I’d classify that as very high risk. (That’s the bottom right hand corner of the graph.)
 
On the other hand 1.3X in 2 years is very low risk and is in the top left hand corner of the graph. (I’ve never seen anyone that lucky.)
 
So that’s the graph – just another rhetorical device. But there are some wrinkles. I’ll list a few – and you can probably think of a few more:
 
  • What if we have "way points"? Say 1.5X in 6 months and 2X in a year?
  • By which metric is it, say, 2X?
  • This says nothing about cost. Zero cost probably means zero speed up. Infinite cost might make the batch go a lot faster.
  • This doesn’t speak to efforts already undertaken. Obviously a thoroughly-well-tuned application is unlikely to speed up as much as an untuned one.
For these reasons I wouldn’t take the graph too seriously and I don’t entirely rely on it. It’s also a part of why I’m leery of committing to precise speed-up numbers.
 
Being a Performance person I hope any fuzz in my language reflects the fuzz in the situation, not a general unwillingness to commit. If you think I’m doing the latter be sure to tell me so.
 
In the meantime I hope you find this rhetorical device useful.

Back From Vacation And Raring To Go – To Poughkeepsie

(Originally posted 2011-08-11.)

Usually when I go away on holiday I bring something back with me. Often in the form of fresh ideas. This year it’s been such a hectic one that all I did was to flake out. So no new ideas this time. Perhaps that’s a good thing, perhaps not. 🙂

But I think I did achieve something: Mental decluttering. So I can, for example, look at stuff I was working on with a fresh take.

And the timing is actually pretty good for that: On Sunday I fly to Poughkeepsie to begin a four-week residency. We’ll be writing a Redbook on "Batch Modernization", following on from Batch Modernization on z/OS, which people seem to have rather liked. 🙂

I actually don’t know who will be on the team: I expect a mixture of the previous team (any of whom I’d be glad to be working with again) and new people (pleased to meet you). 🙂

I also don’t know what we’re going to write about. So I really do start with a "clean mind". 🙂 Or at least, I hope, an open one.

I think some of what I’ve talked about in recent posts could be useful – if not immediately reused – in the Redbook. I’ve also a few bits and pieces in my mind. But it’s a team effort to define shape and content. (And one of my ideas is that we look at each other’s stuff more this time around – to provide a different perspective.)

Now, I think there are two things that concern you, dear reader :-) :

  • A question: Are there topics in the Batch Modernisation realm you’d particularly like to see covered? No promises, but I am interested…
  • A hope: I’d like to think I could take some extracts from what we’re writing and post them here. Again, no promises as the rest of the team might not be happy with these "teasers".

I should point out that it’s not MY residency: My friend Alex Louwe-Kooijmans is running it. And, further, it’s a team effort. But I’m raring to go, recharged from holiday, and hoping to share what I can with you.

(And actually I did experiment with one thing while away: Programming Mac OS X – both Applescript and with Objective C. It’s the first time I’ve really had the chance to get to know my Macbook Pro.)

Another Neat Piece Of Algebra – Series Summation

(Originally posted 2011-07-19.)

Here’s another neat piece of algebra: A technique for summing series.

You know what b – a + c – b + d – c is. Right?

Suppose I were to write the same sum as:

(b – a) +

(c – b) +

(d – c)

The answer is still d – a. Right?

Now, suppose I re-label with s0 = a, s1 = b, s2 = c and s3 = d. We end up with:

(s1 – s0) +

(s2 – s1) +

(s3 – s2)

This is actually pretty scalable terminology as you can write sr for any arbitrary value of r. And that’s one of the strengths of algebra: generalisation.

So let’s do that up to n:

(s1 – s0) +

(s2 – s1) +

(sn – sn-1)

which is, of course, sn – s0.

But what has that got to do with summing series?

If we can replace each (sr – sr-1) by a single term ur you may see the relevance…

u1 + u2 + … + un = sn – s0.

The series summation boils down to a "simple" subtraction. The trick is to find these s terms, given the u terms. Let’s try it with an example.


Summing The Integers


This is the series 1, 2, 3, … , n.

The r’th u term is just r. ur = r. So we now have to find the sr term. Remember sr – sr-1 has to equal r.

Try sr = r (r + 1).

Then sr-1 = (r – 1) r   or   r (r – 1).

So sr – sr-1 = [(r + 1) – (r – 1)] r   or   2r. Not quite what we wanted. But we know – dividing by the factor of 2 – we should’ve guessed sr = ½ r (r + 1).

So sn – s0 = ½ n (n + 1) – ½ 0 (0 + 1) = ½ n (n + 1) – 0 = ½ n (n + 1).

The sum of the first n integers being ½ n (n + 1) is a well-known result. Admittedly it could’ve been done another way. But it’s simple enough to show the method.


Another Example – Summing The Squares Of The Integers


This is the series 1, 4, 9, … , n² .

In this case we need to do something that will appear slightly perverse:

Rewrite r² as r ( r + 1) – r.

If you can split each of the terms in a series into two terms you can sum these sub terms. I just did the split. We already know how to sum the "r" portion. It’s ½ n (n + 1). So we need to sum the r (r+1) portion and subtract ½ n (n+1) from the result.

Try sr = r (r + 1) (r + 2).

Again we need to find sr-1.

It’s:

(r – 1) r (r + 1)

or, rearranging,

r (r+1) (r-1)

So

sr – sr-1 = [(r + 2) – (r – 1)] r (r + 1) or 3r (r + 1).

This is 3 times what we want so we should’ve guessed sr = 1/3 r (r + 1) (r + 2).

So this portion of the sum is 1/3 n (n + 1) (n + 2) – 1/3 0 (0 + 1)(0 + 2) or 1/3 n (n + 1) (n + 2).

But we need to subtract ½ n (n + 1) from this:

1/3 n (n + 1) (n +2) – ½ n (n + 1) = 2/6 n (n + 1) (n +2) – 3/6 n (n + 1)

or

1/6 n (n + 1) [ 2 (n + 2) – 3] = 1/6 n (n + 1)( 2 n + 1) .

If you try it for a few values you’ll see it’s right. This isn’t such a well known result as for the sum of the integers.


I’m conscious there’s been some fiddliness here – which is where I normally fall down. 😦

But I think the "sum a series by converting it to a single subtraction" trick is a neat one – which is why I share it with you.